Illustration & Infographic

Making PowerPoint decks and word docs green with envy…

Infographic Illustration

Human beings are visually wired. We can get the sense of a visual scene in less than 1/10 of a second. It only takes 150 milliseconds for a symbol to be processed, and 100 milliseconds to attach meaning to it.

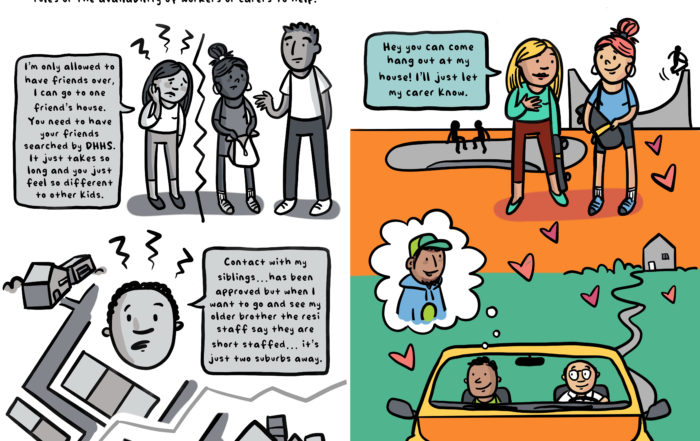
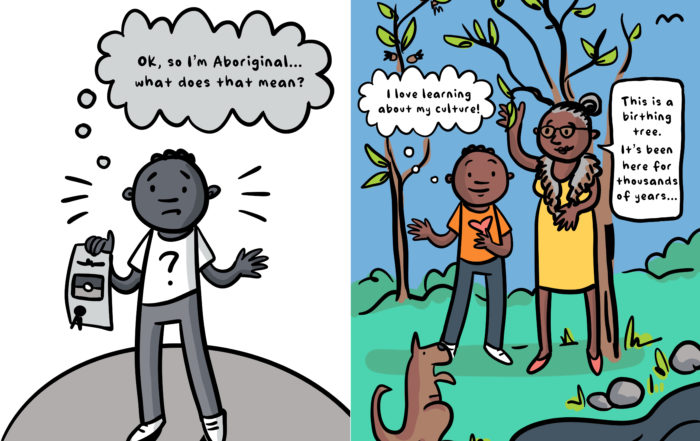
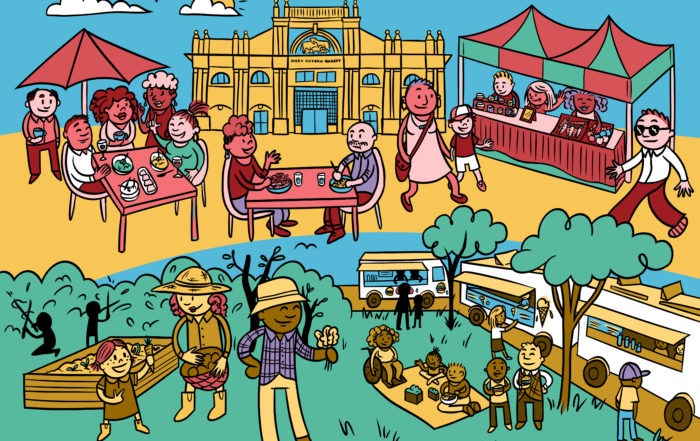
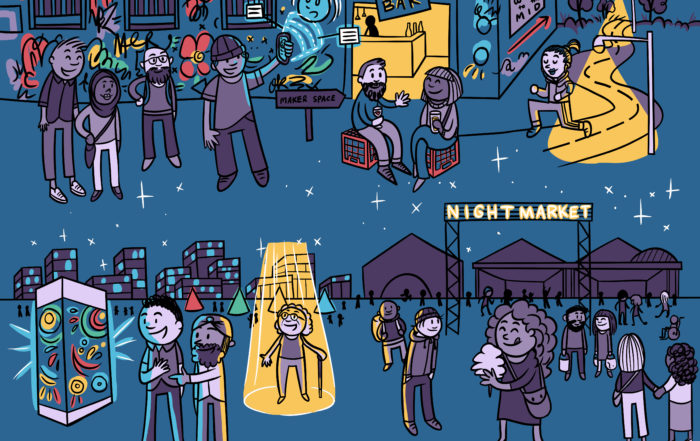
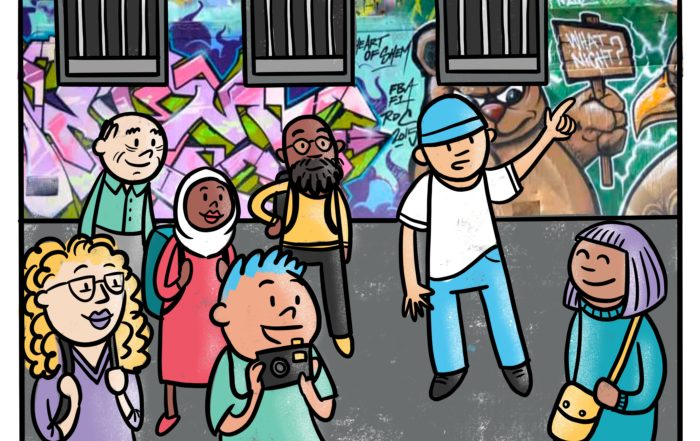
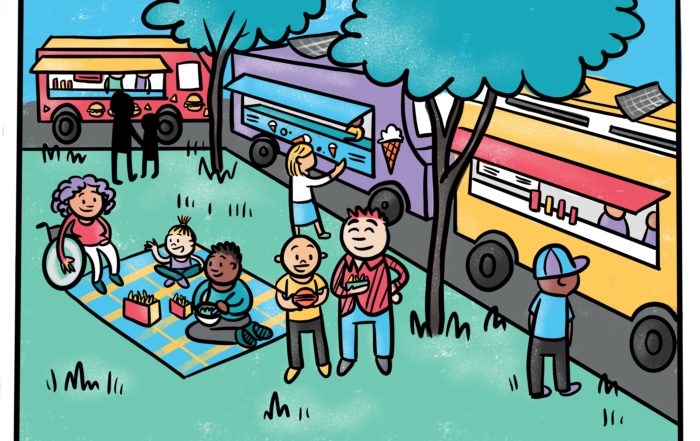
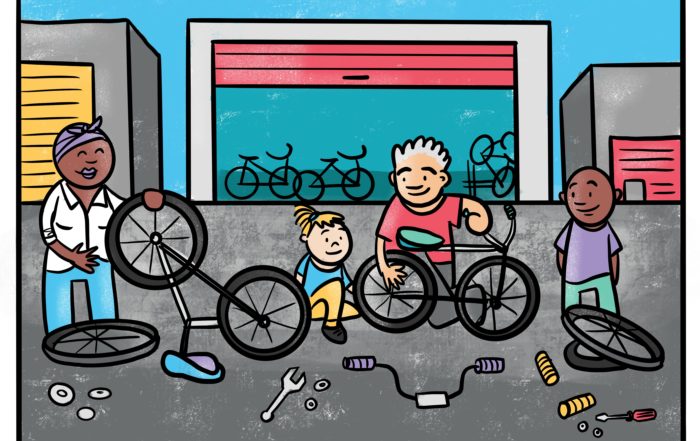
Using imagery is a powerful way to help visualise strategy and structure, history and context, important content and data, or the journey ahead – and communicate it in an accessible, engaging and shareable way.

Think in Colour works closely with our clients to create explainer illustrations, journey maps, infographics, strategies on a page, business plans on a page, models and more.

What’s the difference between illustrations / infographics and graphic recording?

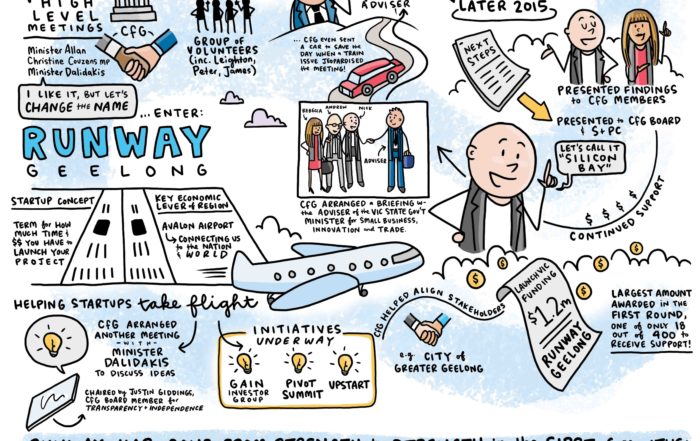
Illustrations are created in the studio from a brief, whereas graphic recording is the live illustration of content captured in real-time at workshops, conferences and presentations.

  1. You provide us with an initial brief including size specifications, usage details (e.g. print, online), rough overview of content, audience and objective of the project.
  2. We provide you with a quote for the work.
  3. You provide us with the content (this could be a written document, a rough sketch – whatever’s the easiest way to get the info from your brain to ours), and any relevant reference material (e.g. photographs, logos, etc).
  4. Once accepted, we send you a rough ‘layout draft’, to check that we’ve understood the brief and the information flow correctly.
  5. We then create a full draft (like a digital pencil drawing), possibly with a check-in or two along the way to ensure we’re on the right track.
  6. We go through one full edit cycle on the draft, and a second if required.
  7. The illustration is then inked and coloured to a palette of your choosing.
  8. VOILA! Enjoy your dope illustration.

Final artwork will be delivered in jpeg and/or PDF format, in line with size specifications provided.
Suggested uses for infographic illustrations:

  • Embed on your website
  • Share on social media / blog posts
  • Include as a resource on your intranet or platform
  • Embed in PowerPoint presentation decks
  • Use as part of your inductions / training
  • Print on paper, canvas or wall decal for your office or other spaces
  • Print as calendars, mousepads, or other useful things
  • Use as an internal and external communication tool

Infographics in action

“Super talent and excellent interpretation of the brief!”

“We engaged Think in Colour at very short notice to create an interesting learning story on our feature blackboard wall in the office. Jessamy was easy to deal with from the get-go, with the perfect mix of professionalism and creativity. Everyone loved watching the process and we achieved a great outcome. Super talent and excellent interpretation of the brief!”

– Mandy Balla-Kellett, for NAB